Prater & Borden
Working with historical data, as useful as it is, for machine learning algorithms cannot go without avoiding bias that is hidden deep in the data. In 2014, Brisha Borden, 18, was charged for committing theft of property worth eighty dollars after she decided to ride a child’s bicycle that had been left abandoned and unsecured. Brisha has committed lesser offences in the past as a juvenile.
A year earlier, forty-one year old Vernon Prater was caught stealing tools from a shop with a total value of $86.35. Vernon had already been charged with armed robbery, for which he received a five-year prison sentence. He was also charged with attempted armed robbery.
In the USA at the time, a risk prediction system was used to assess whether a person would commit other crimes in the future. This system gave a rating from 1 to 10, where the higher the numerical value, the higher the risk of committing crimes in the future. Borden – a black teenager – was given a high risk rating: 8, and Prater, on the other hand – a white, adult male – a low risk rating: 3. After two years, Brisha Borden had committed no crime, while Vernon Prater was serving an eight-year prison sentence after breaking into a warehouse and stealing electronics worth several thousand dollars. [1]
Hidden data
Automated machine learning and big data systems are increasing in number in our daily lives. From algorithms suggesting a series for the user to watch, to one that will decide the instalment of your mortgage. However, the moment an algorithm decides on such an important issue for a human being, the dangers begin to emerge. Can we even trust such systems to make important decisions? Computer algorithms give a sense of impartiality and objectivity. But is this really the case?
In a nutshell, machine learning algorithms “learn” to make decisions based on the data provided. Regardless of the method of this learning, be it simple decision trees or more sophisticated artificial neural networks, by design the algorithm should extract patterns hidden in the data. Thus, the algorithm will only be as objective as the learning data is objective. While one might agree that, for example, medical or weather data are objective because the expected results are not the result of human decisions, decisions about, for example, the granting of credit or employment were historically made by people. Naturally, people are not fully objective and are guided by a certain worldview and, unfortunately, also by prejudices. The bias found its way into the data in a more or less direct way.
The issue of preparing data suitable for training machine learning algorithms is a very broad topic. A discussion of possible solutions is a topic for a separate article.
In this case, since we do not want the algorithm to make decisions based on gender, age or skin colour, is it not possible to simply not provide this data? This naive approach, while seeming logical, has one big loophole. Information about this sensitive data can be (and probably is) coded into other, seemingly unrelated information.
Historical data are created by people, and unfortunately bias guides certain people. These decisions percolate through the data, and even if when creating a model, one considers not to include data on race, age, gender, etc. in the input, it may be that this information gets through indirectly through, for example, postcode information. It may be possible, for example, to use Bayesian networks to visualise the interconnections between different features. This tool aims to show where data, based on which one would not want to make decisions, may be hidden. [2]
Judicial risk assessment system in the USA
Reference should again be made to the algorithm used in the US penal system (COMPAS system). Julia Dressel and Hany Farid [3] tried to investigate how this system works. First, they conducted a survey in which respondents with no background in criminology were given a brief description of the accused person’s crime (including their age and gender, but not their race) and a history of previous prosecutions, their aim was to predict whether the person would be convicted again in the next two years. The results of the survey conducted showed an efficiency (67%) similar to the system used by the US penal system (65.2%). Interestingly, the proportion of false-positive responses, i.e. where defendants were incorrectly assigned to a high-risk group, was consistent regardless of race. Black people, both in the anonymous survey and according to COMPAS, were more likely to be categorised in the higher risk group than white people, leading to bias. As a reminder – survey respondents had no information about the race of those accused.
Other machine learning methods were then tested, including a logistic regression algorithm with two features in the input – age and number of previous accusations. This algorithm works in such a way that individual measurements from the training dataset are placed on (in this case) a two-dimensional plane (each axis is the value of a given feature). A straight line is then drawn separating cases from two different categories. Usually, it is not possible to draw a perfect straight line that separates the two categories without error. Therefore, a straight line for which the error is minimal is determined. In this way, a straight line is obtained that divides the plane into two categories – those who have been charged within two years and those who have not been charged (Fig.1).

This algorithm has an efficiency (66.8%) similar to COMPAS (65.4%). In this case too, a much higher proportion of black people incorrectly classified as higher risk than white people was observed.
As it turns out, information about race can also permeate the arrest rate data [2][3]. In the US, for example, black people are arrested for drug possession four times more often than white people [8][9].
Non-functioning models
Sometimes models just do not work.
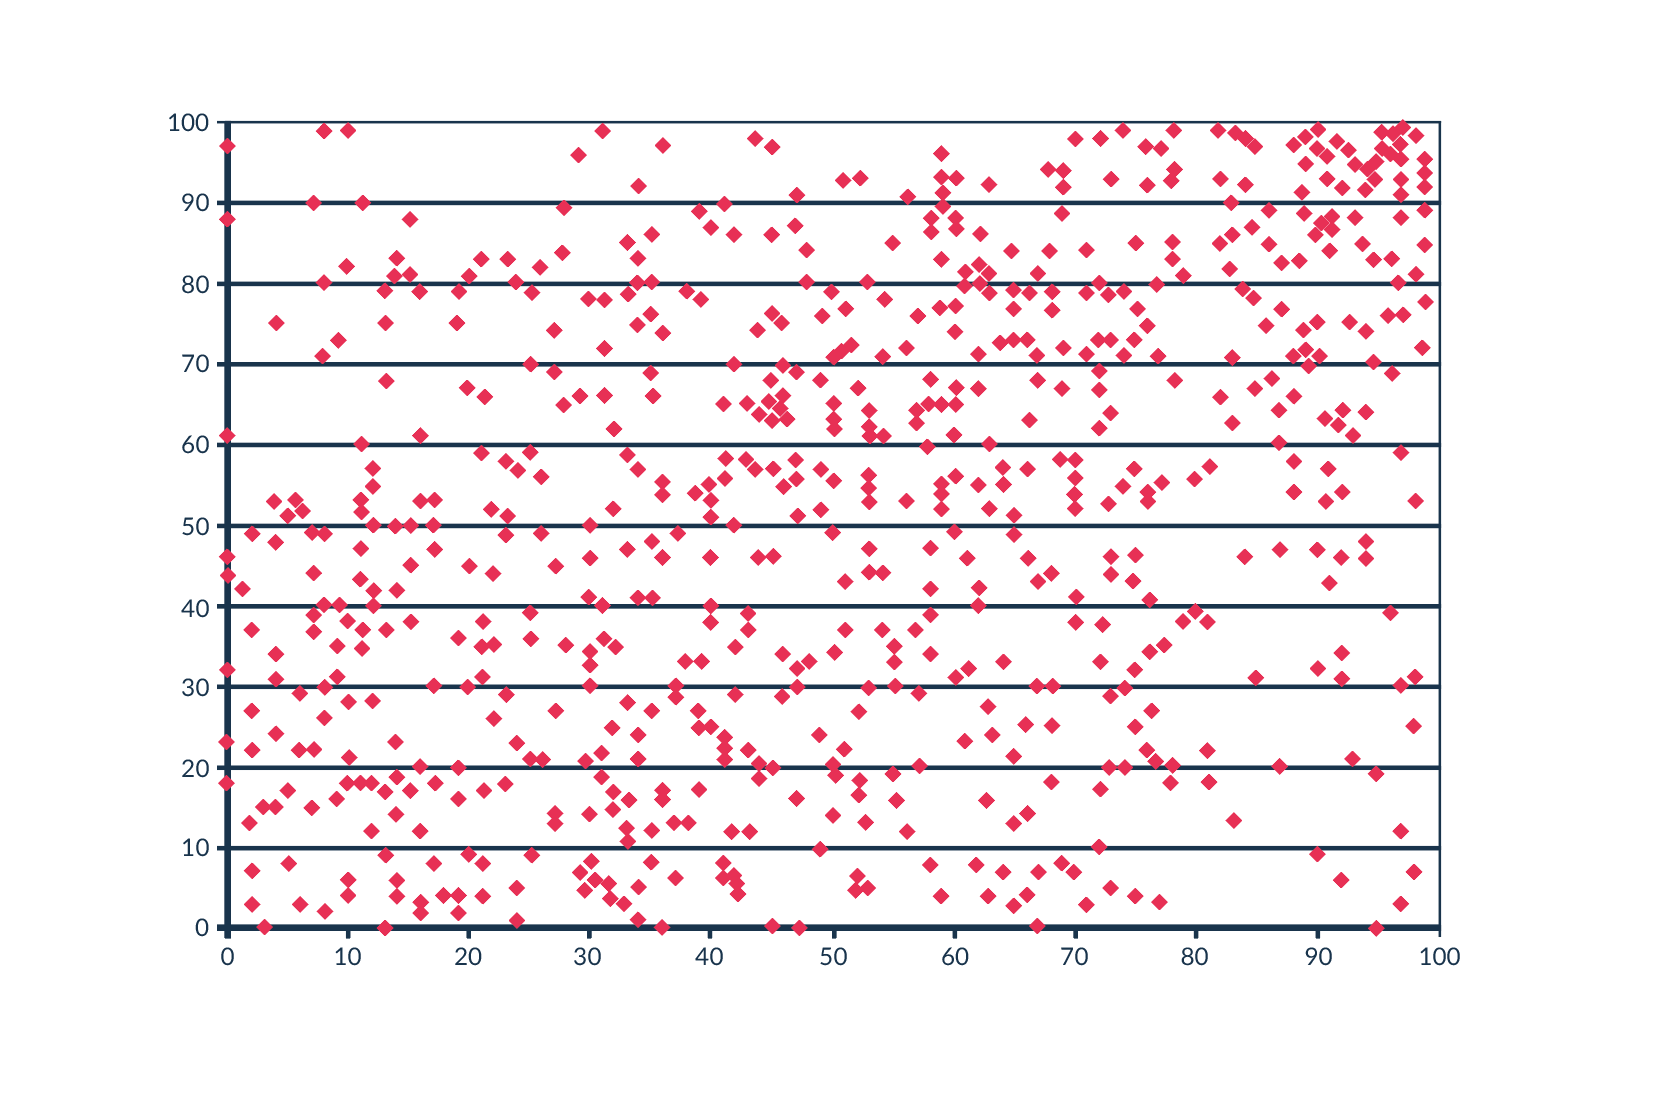
In 2012, data from a rating system for New York City teachers from 2007 to 2010 was published. This system gave teachers a rating from 1 to 100 supposedly based on the performance of the teacher’s students. Gary Rubinstein [4] decided to look at the published data. The author noted that in the statistics, teachers who had been included in the rating programme for several years had a separate rating for each year. Based on the assumption that a teacher’s rating should not change dramatically from year to year, he decided to see how it changed in reality. Rubinstein outlined the teachers’ ratings, where on the X-axis he marked the first-year teaching rating and on the Y-axis the second-year teaching rating for the same class. Each dot on the graph represents one teacher (Fig.2).

The logical result would be a near linear relationship or some other correlation, due to the fact that the results of the same class with one teacher should not change drastically from year to year. Here, the graph looks more like a random number generator, with some classes rated close to 100, the next year had a score close to 0 and vice versa. Such a result should not be generated by the system on the basis of which teachers’ salaries are set, or even whether to dismiss such a person, as this system simply does not work.
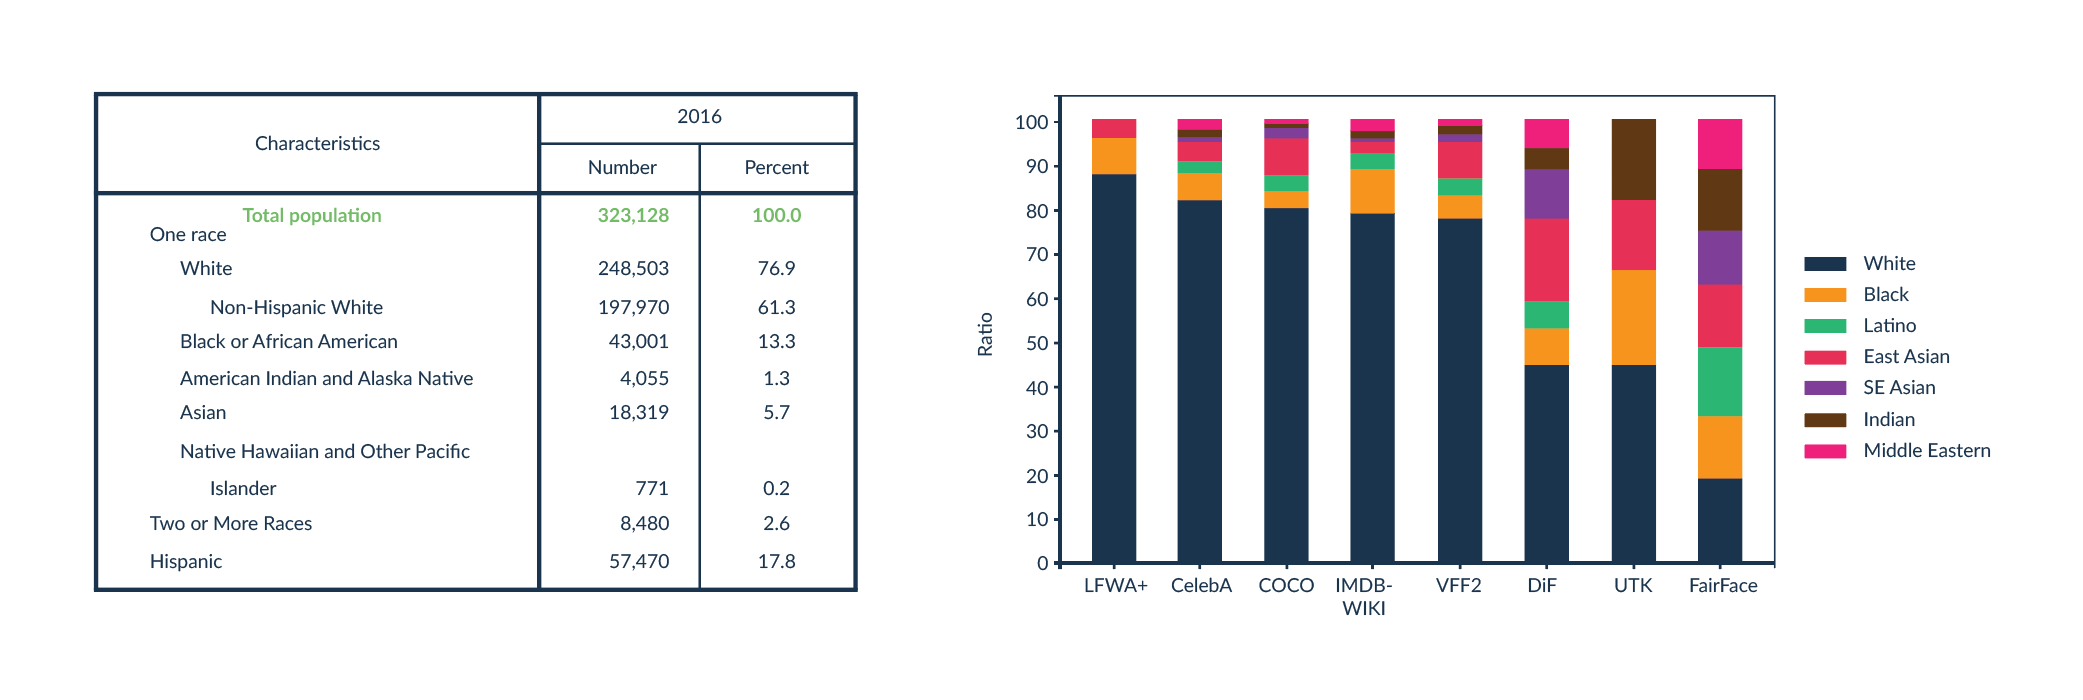
Face recognition algorithms have a similar problem. Typically, such technologies are set up so that a machine learning algorithm analyses multiple images that are a face and multiple images that represent something else. The system detects patterns that are characteristic of faces that are not present in other images. The problem starts when someone has a face that deviates from those present in the training dataset. Those creating such an algorithm should try to have as diverse a training dataset as possible. Unfortunately, it turns out that there is often an under-representation of people with darker skin colour in the training datasets. Those most often have a skin colour distribution similar to the society from which the data are collected. That is, if the training dataset consists of images of US and European citizens, for example, then the percentage of each skin colour in the dataset shall be similar to that of the US and European demographics, where light-skinned people predominate (Fig.3).

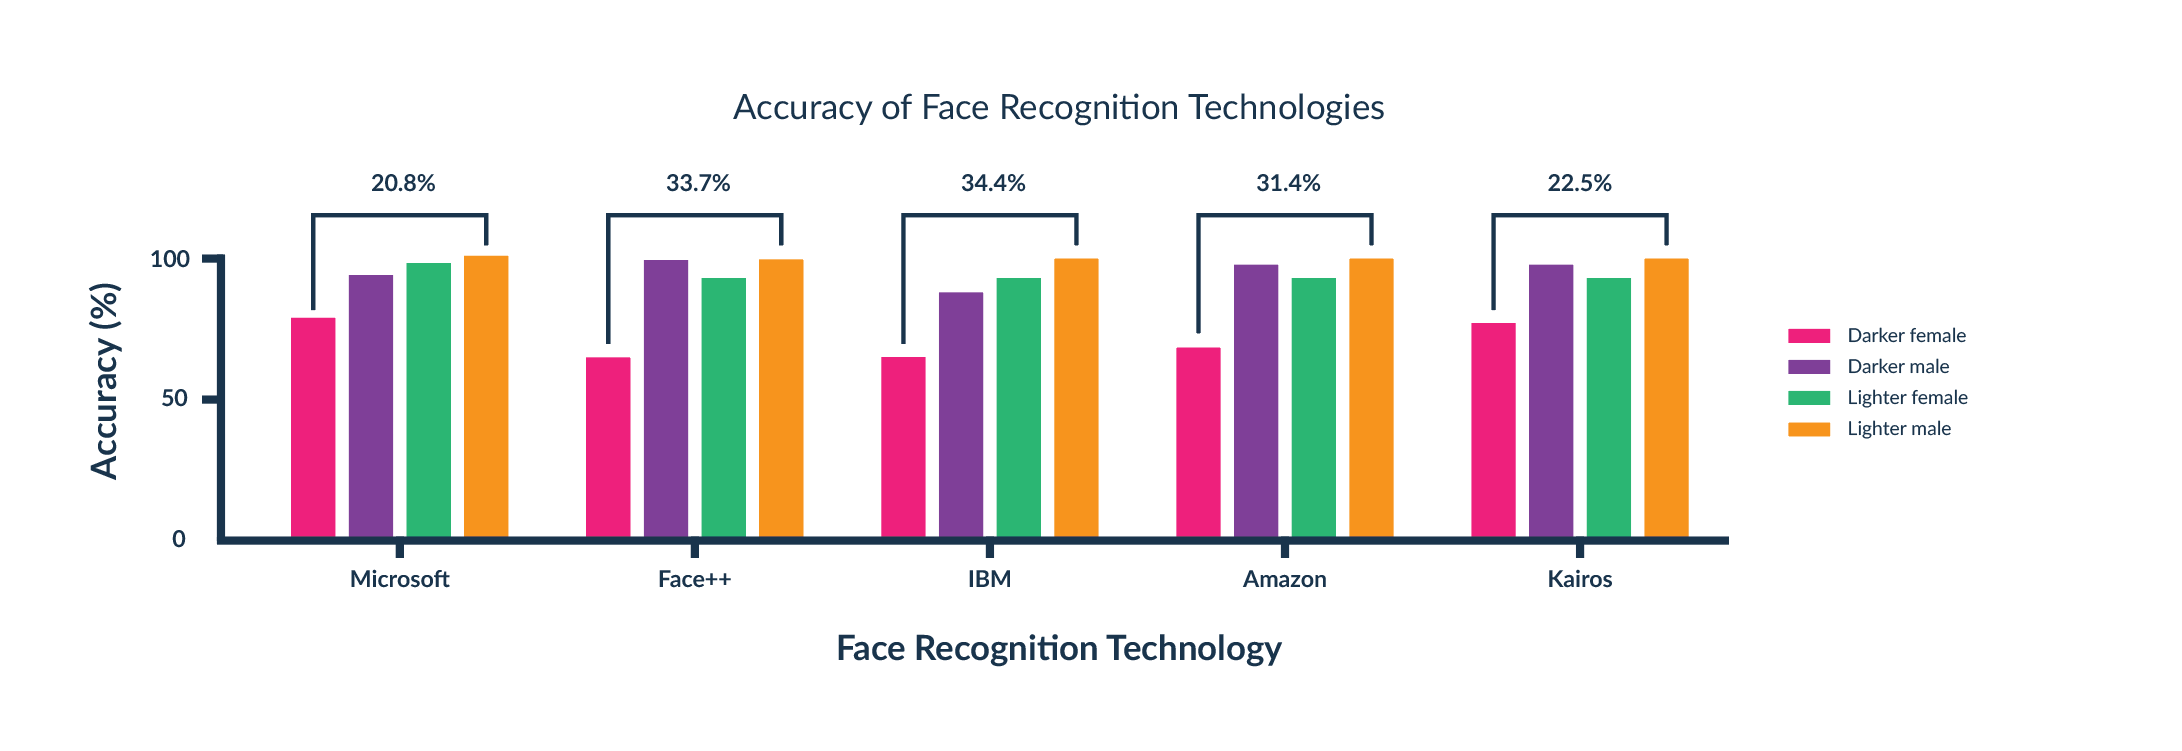
At MIT University [5], the accuracy of facial recognition algorithms by gender and skin colour was investigated. They found that the technologies of the most popular companies, such as Amazon and IBM, fell to bias – they failed to recognise women with dark skin colour (Figure 4). When these technologies are used in products that use facial recognition technology, there is an issue of availability and security If the accuracy is low even for one specific group, there is a high risk of someone unauthorised to access, for example, a phone. At a time when facial recognition technology is being used by the police in surveillance cameras, there is a high risk that innocent people will be wrongly identified as wanted persons. Such situations have already occurred many times. All this due to a malfunctioning algorithm, which could quite easily be fixed with the right selection of training datasets, avoiding any kind of bias.

Following the publication of the MIT study, most companies have improved the performance of their algorithms so that the disparity in facial recognition is negligible.
Inclusive code
We cannot be 100 per cent trusting of machine learning algorithms and big data, especially when it comes to deciding human fate.
In order to create a tool that is effective, and does not learn human bias, one has to go down to the data level. It is necessary to analyse the interdependencies of attributes that may indicate race, gender or age and select those that are really necessary for the algorithm to work correctly. It is then essential to analyse the algorithm itself and its results to ensure that the algorithm is indeed objective.
Machine learning models learn by searching for patterns and reproducing them. When unfiltered historical data is provided, no new, more effective tools are actually created, but the status quo is automated. And when human fate is involved, we as developers cannot afford to repeat old mistakes.
References:
[1] https://www.propublica.org/article/machine-bias-risk-assessments-in-criminal-sentencing
[2] https://arxiv.org/pdf/2110.00530.pdf
[3] J. Dressel, H. Farid, “The accuracy, fairness, and limit of predicting recidivism”
[4] https://garyrubinstein.wordpress.com/2012/02/26/analyzing-released-nyc-value-added-data-part-1/
[5] https://sitn.hms.harvard.edu/flash/2020/racial-discrimination-in-face-recognition-technology/
[6] https://www.census.gov/content/dam/Census/library/publications/2020/demo/p25-1144.pdf
[7] Kimmo K ̈arkk ̈ainen, Jungseock Joo, “FairFace: Face Attribute Dataset for Balanced Race, Gender, and Age for Bias Measurement and Mitigation”
[8] https://www.aclu.org/report/tale-two-countries-racially-targeted-arrests-era-marijuana-reform?eType=EmailBlastContent&eId=f3aa6ff4-fdc5-4596-b96a-2c0fe443df39