Application of Machine Learning in Data Lakes

In the digital age, there is a growing need for advanced technologies. It means not only for collecting but especially for analysing data. Companies are accumulating increasing amounts of different information that can improve their efficiency and innovation. Data Engineering offered by BFirst.Tech can play a key role in the process of using data for the benefit of a company. This is an area of sustainable products for effective information management and processing. The article presents one of the opportunities offered by the Data Engineering area. For example the integration of Machine Learning with Data Lakes. 

Data Engineering – an area of ​​sustainable products dedicated to collecting, analysing and aggregating data 

Data engineering is a process of designing and implementing systems for the effective collection, storage and processing of large sets of data. This supports the accumulation of information such as website traffic analysis, data from IoT sensors or consumer purchasing trends. Firstly, the task of data engineering is to ensure that information is skillfully collected. What is more, it is stored but also easily accessible and ready for analysis. Data can be effectively stored in Lakes, Data Storages and Data Warehouses. Such integrated data sources can be used to create analyses or feed artificial intelligence engines, which ensures comprehensive use of the collected information (see the detailed description of the Data Engineering area (img 1)). 

Data Engineering

img 1 – Data Engineering

Data lakes used for storing sets of information    

Data lakes enable storing a huge amount of raw data in its original, unprocessed format. Thanks to the possibilities offered by Data Engineering, data lakes are capable of accepting and integrating data from a wide variety of sources. For instance, text documents, images, IoT sensor data. It makes it possible to analyse and utilise complex sets of information in one place. The flexibility of data lakes and their ability to integrate diverse types of data make them extremely valuable to organisations facing the challenge of managing and analysing dynamically changing data sets. Unlike Data Warehouses, Data Lakes offer greater versatility in handling a variety of data types, made possible by advanced data processing and management techniques used in Data Engineering. However, that versatility also raises challenges in the area of storing and managing such complex sets of data. It requires data engineers to constantly adapt and implement innovative approaches.[1, 2] 

Information processing in data lakes and the application of machine learning   

The increasing volume of stored data and its diversity pose a challenge in the area of effective processing and analysis. Traditional methods are often unable to keep up with the growing complexity. What is more, they lead to delays and limitations in accessing key information. Machine Learning, supported by innovations in Data Engineering, can significantly improve those processes. Using extensive data sets, Machine Learning algorithms identify patterns, predict outcomes and automate decisions. Thanks to the integration with Data Lakes (img 2), they can work with a variety of data types. That is to say, structured to unstructured, enabling more complex analyses. Such comprehensiveness enables a more thorough understanding and use of data that would be inaccessible in traditional systems.

Applying Machine Learning to Data Lakes enables deeper analysis and more efficient processing. It facilitates the process by advanced Data Engineering tools and strategies. This enables organisations to transform great amounts of raw data into useful and valuable information. That is important for increasing their operational and strategic efficiency. Moreover, the use of Machine Learning supports the interpretation of collected data and contributes to more informed business decision-making. As a result, companies can adapt to market demands more dynamically, and create data-driven strategies in an innovative way. 

Data Lake

img 2 – Data Lakes

Fundamentals of Machine Learning, key techniques and their application  

In this paragraph, let’s discuss Machine Learning. as an integral part of the so-called artificial intelligence. It enables information systems to learn and develop based on data. Different types of learning are distinguished in that field: Supervised Learning, Unsupervised Learning and Reinforcement Learning. In Supervised Learning, each type of data is assigned a label or score that allows machines to learn. For example, to recognise patterns and create forecasts. That type of learning is used in image classification or financial forecasting, inter alia. In turn, Unsupervised Learning, in the case of which unlabeled data is used, focuses on finding hidden patterns and is useful in tasks such as grouping elements or detecting anomalies. Reinforcement Learning is based on a system of rewards and punishments. It helps machines to optimise their actions under dynamically changing conditions, e.g. games or automation. [3]

In terms of algorithms, neural networks are excellent for recognising patterns in complex data, such as images or sound. It also forms the basis of many advanced AI systems. Decision trees are used for classification and predictive analysis, for example in recommendation systems or sales forecasting. Each of those algorithms has unique applications and can be tailored to the specific needs of a task or problem. As a result, it makes Machine Learning a versatile tool in the world of data. 

Examples of applications of Machine Learning 

The application of Machine Learning to Data Lakes opens up a wide spectrum of possibilities. We can enumerate from anomaly detection, through personalisation of offers, to optimisation of supply chains. In the financial sector, such algorithms effectively analyse transaction patterns and identify anomalies or potential fraud in real time. That is crucial in preventing financial fraud. In retail and marketing, Machine Learning enables the personalisation of offers to customers. It happens by analysing purchase behaviour and preferences, increasing customer satisfaction and sales efficiency. [4] In industry, the algorithms contribute to the optimisation of supply chains by analysing data from various sources – as weather forecasts or market trends. It helps predicting demand and manage inventory and logistics [5].

They can also be used for pre-design or product optimisation. Another interesting application of Machine Learning in Data Lakes is image analysis. Machine Learning algorithms are able to process and analyse large sets of images and pictures. They are used in fields such as medical diagnostics, where they can help detect and classify lesions in radiological images, or in security systems, where camera image analysis can be used to identify and track objects or people.  

 CONCLUSIONS  

The article emphasises developments in the field of data analytics, highlighting how Machine Learning, Data Lakes and data engineering influence the way organisations process and use information. Introducing such technologies into business improves existing processes and opens the way to new opportunities. The Data Engineering area introduces modernisation into information processing, characterised by greater precision, deeper conclusions and faster decision-making.  That progress emphasises the growing value of Data Engineering in the modern business world, which is an important factor in adapting to dynamic market changes and creating data-driven strategies. 

References 

[1] https://bfirst.tech/data-engineering/ 

[2] https://www.netsuite.com/portal/resource/articles/data-warehouse/data-lake.shtml 

[3] https://mitsloan.mit.edu/ideas-made-to-matter/machine-learning-explained 

[4] https://www.tableau.com/learn/articles/machine-learning-examples 

[5]https://neptune.ai/blog/use-cases-algorithms-tools-and-example-implementations-of-machine-learning-in-supply-chain 

New developments in desktop computers

Today’s technology market is thriving with desktop computers. Technology companies are trying to differentiate their products by incorporating innovative features into them. Recently, the Mac M1 Ultra has received a lot of recognition.

The new computer from Apple, stands out above all for its size and portability. Unveiled at the beginning of March, the product is a full-fledged desktop enclosed in a case measuring 197 x 197 x 95 mm. Comparing this to Nvidia’s RTX series graphics cards, for instance the Gigabyte GeForce RTX 3090 Ti 24GB GDDR6X, where the GPU alone measures 331 x 150 x 70 mm, it appears that one gets a whole computer the size of a graphics card. [4]

Apple M1 Ultra  - front panel
Fig. 1 – Apple M1 Ultra  – front panel [5]

Difference in construction

Cores are the physical parts of a CPU where processes and calculations take place; the more cores the faster the computer will run. The technological process expressed in nm represents the gate size of the transistor and translates into the power requirements and heat generated by the CPU. So the smaller the value expressed in nm, the more efficient the CPU.

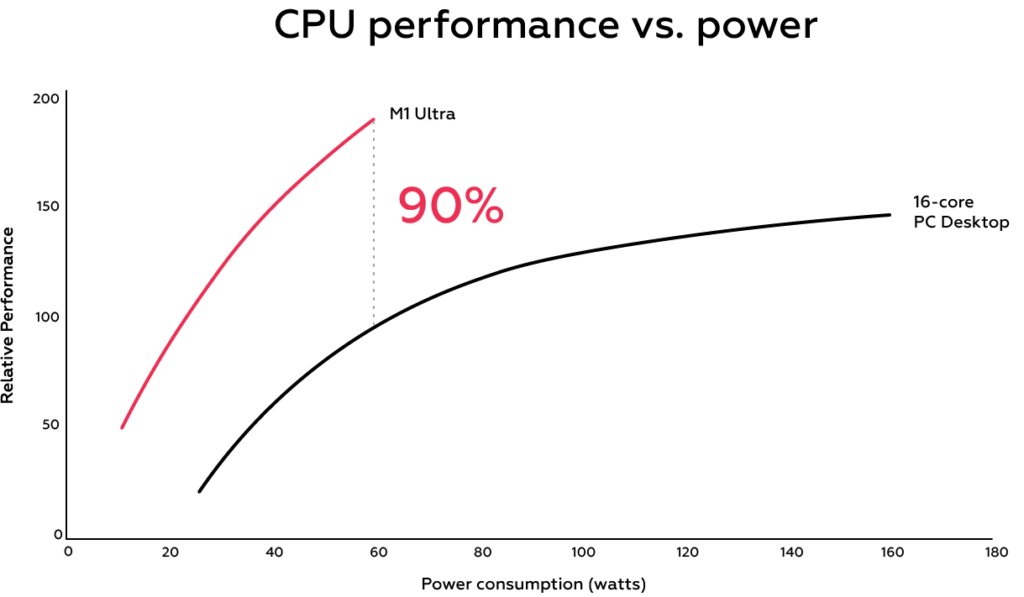
The M1 Ultra CPU has 20 cores and the same number of threads, and is made with 5nm technology. [4][6] In comparison, AMD offers a maximum of 16 cores and 32 threads in 7nm technology [7] (AMD’s new ZEN4 series CPUs are expected to have 5nm technology, but we do not know the exact specifications at this point [3]) and Intel 16 cores and 32 threads in 14nm technology [8]. In view of the above, in theory, the Apple product has a significant advantage over the competition in terms of single thread performance. [Fig. 2]

Performance of the new Apple computer

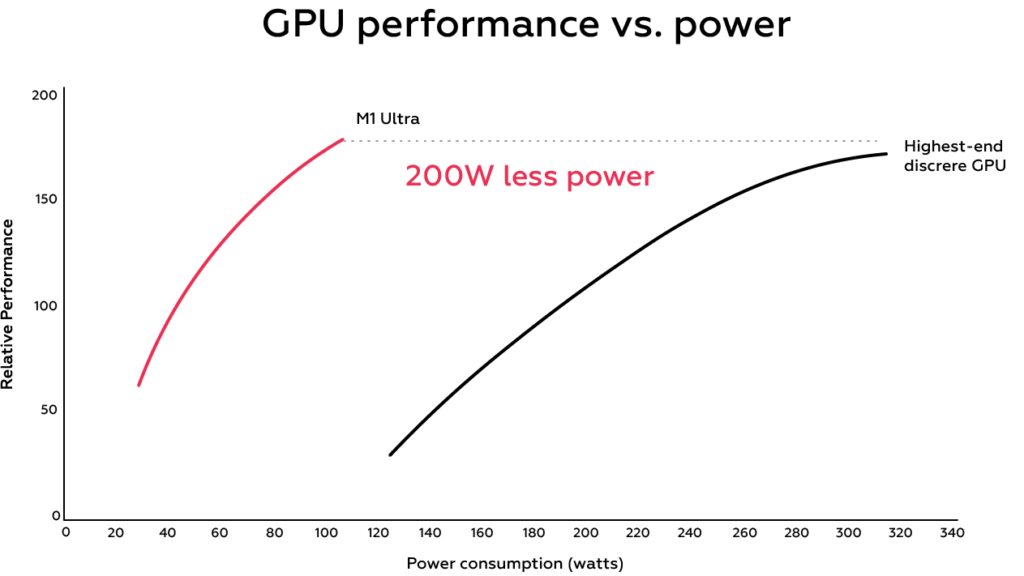
According to the manufacturer’s claims, the GPU from Apple was supposed to outperform the best graphics card available at the time, the RTX 3090.

Graph of the CPU performance against the amount of power consumed
Fig. 2 – Graph of the CPU performance against the amount of power consumed [9]. Graph shown by Apple during the presentation of a new product

The integrated graphics card was supposed to deliver better performance while consuming over 200W less power. [Fig. 3] After the release, however, users quickly checked the manufacturer’s assurances and found that the RTX significantly outperformed Apple’s product in benchmark tests.

Graph of graphics card performance against the amount of power consumed
Fig. 3 – Graph of graphics card performance against the amount of power consumed [9]. Graph shown by Apple during the presentation of a new product. Compared to RTX 3090

The problem is that these benchmarks mostly use software not optimised for the Mac OS, so that the Apple product does not use all of its power. In tests that use the full GPU power, the M1 Ultra performs very similarly to its dedicated rival. Unfortunately, not all applications are written for Apple’s OS, severely limiting the applications in which we will use the full power of the computer.[10]

The graph below shows a comparison of the frame rate in “Shadow of the Tomb Raider” from 2018. [Fig. 4] The more frames, the smoother the image.  [2]

The frame rate of the Tomb Raider series game (the more the better)
Fig. 4 – The frame rate of the Tomb Raider series game (the more the better) [2].

Power consumption of the new Mac Studio M1 Ultra compared to standard PCs

Despite its high computer performance, Apple’s new product is very energy-efficient. The manufacturer states that its maximum continuous power consumption is 370W. Standard PCs with modern components do not go below 500W and the recommended power for hardware with the best parts is 1000W [Table 1] ( Nvidia GeForce RTX 3090 Ti + AMD R7/9 or Intel i7/9 ).  

Intel i5
AMD R5
Intel i7
AMD R7
Intel i9 K
AMD R9
NVIDIA RTX 3090 Ti850W1000W1000W
NVIDIA RTX 3090 750W850W850W
NVIDIA RTX 3080 Ti750W850W850W
NVIDIA RTX 3080 750W850W850W
NVIDIA RTX 3070 Ti750W850W850W
NVIDIA RTX 3070 650W750W750W
Lower graphic cards650W650W650W
Table 1 – Table of recommended PSU wattage depending on the CPU and graphics card used. AMD and Intel CPUs in the columns, NVIDIA RTX series graphics cards in the rows. [1]

This means significantly lower maintenance costs for such a computer. Assuming that our computer works 8 hours a day and an average kWh cost of PLN 0.77, we obtain a saving of PLN 1,500 a year. In countries that are not powered by green energy, this also means less pollution.

Apple’s product problems

Products from Apple have dedicated software, which means better compatibility with the hardware and translates into better performance, but it also means that a lot of software not written for Mac OS cannot fully exploit the potential of the M1 Ultra. The product does not allow the use of two operating systems or the independent installation of Windows/Linux. So it turns out that what allows the M1 Ultra to perform so well in some conditions is also the reason why it is unable to compete in performance in other programs. [10]

Conclusion

The Apple M1 Ultra is a powerful computer in a small box. Its 5nm technology provides the best energy efficiency among products currently available on the market. However, due to its low compatibility and high price, it will not replace standard computers. To get maximum performance, dedicated software for the Apple operating system is required. When deciding on this computer, one must keep this in mind. For this reason, despite its many advantages, it is more of a product for professional graphic designers, musicians or video editors.

References

[1] https://www.msi.com/blog/we-suggest-80-plus-gold-1000w-and-above-psus-for-nvidia-geforce-rtx-3090-Ti

[2] https://nano.komputronik.pl/n/apple-m1-ultra/

[3] https://www.tomshardware.com/news/amd-zen-4-ryzen-7000-release-date-specifications-pricing-benchmarks-all-we-know-specs

[4] https://www.x-kom.pl/p/730594-nettop-mini-pc-apple-mac-studio-m1-ultra-128gb-2tb-mac-os.html

[5] https://dailyweb.pl/apple-prezentuje-kosmicznie-wydajny-mac-studio-z-nowym-procesorem-m1-ultra/

[6] https://geex.x-kom.pl/wiadomosci/apple-m1-ultra-specyfikacja-wydajnosc/

[7] https://www.amd.com/pl/partner/ryzen-5000-series-desktop

[8] https://www.cpu-monkey.com/en/

[9] https://www.apple.com/pl/newsroom/2022/03/apple-unveils-m1-ultra-the-worlds-most-powerful-chip-for-a-personal-computer/

[10] https://youtu.be/kVZKWjlquAU?t=301

ANC — Financial Aspects

Today’s realities are making people increasingly inclined to discuss finances. This applies to both private household budgets and major, global-level investment projects. There is no denying the fact that attention to finances has resulted in the development of innovative methods of analysing them. These range from simple applications that allow us to monitor our day-to-day expenses to huge accounting and bookkeeping systems that support global corporations. The discussions about money also pertain to investment projects in a broader sense. They are very often associated with the implementation of modern technologies, which are implicitly intended to bring even greater benefits, with the final result being greater profit. Yet how do you define profit? And is it really the most crucial factor in today’s perception of business? Finally, how can active noise reduction affect productivity and profit?

What is profit?

The literature explains that “profit is the excess of revenue over costs” [1]. In other words, profit is a positive financial result. Colloquially speaking, it is a state in which you sell more than you spend. This is certainly a desirable phenomenon since, after all, the idea is for a company to be profitable. Profit serves as the basis for further investment projects, enabling the company to continue to meet customer needs. Speaking of profit, one can distinguish several types of it [2]:

  1. Gross profit, i.e. the difference between net sales revenue and costs of products sold. It allows you to see how a unit of your product translates into the bottom line. This is particularly vital for manufacturing companies, which often seek improvements that will ultimately allow them to maintain economies of scale.
  2. Net profit, i.e. the surplus that remains once all costs have been deducted. In balance sheet terms, this is the difference between total costs and sales revenue. In today’s world, it is frequently construed as a factor that indicates the financial health of an enterprise.
  3. Operating profit, i.e. a specific type of profit that is focused solely on the company’s result in its core business area. It is very often listed as EBIT in the profit and loss account.

Profit vs productivity

In this sense, productivity involves ensuring that the work does not harm the workers’ lives or health over the long term. The general classification of the Central Institute for Labour Protection lists such harmful factors as [3]:

  • noise and mechanical vibration,
  • mechanical factors,
  • chemical agents and dust,
  • musculoskeletal stress,
  • stress,
  • lighting,
  • optical radiation,
  • electricity.

The classification also lists thermal loads, electromagnetic fields, biological agents and explosion and fire hazards. Yet the most common problem is that of industrial noise and vibrations that the human ear is often unable to pick up at all. It has often been the case that concentration decreased while sleepiness levels increased while working in a perpetually noisy environment. Hence, one may conclude that even something as inconspicuous as noise and vibration generates considerable costs for the entrepreneur, especially in terms of unit costs (for mass production). As such, it is crucial to take action in noise reduction. If you would like to learn more about how to combat noise pollution, click here to sign up for training.

How do you avoid incurring costs?

Today’s R&D companies, engineers and specialists thoroughly research and improve production systems, which allows them to develop solutions that eliminate even the most intractable human performance problems. Awareness of better employee care is deepening year on year. Hence the artificial intelligence boom, which is aimed at creating solutions and systems that facilitate human work. However, such solutions require a considerable investment, and as such, financial engineers make every effort to optimise their costs.

Step 1 — Familiarise yourself with the performance characteristics of the factory’s production system in production and economic terms.

Each production process has unique performance and characteristics, which affect production results to some extent. To be measurable, these processes must be examined using dedicated indicators beforehand. It is worth determining process performance at the production and economic levels based on the knowledge of the process and the data that is determined using such indicators. The production performance determines the level of productivity of the human-machine team, while the economic performance examines the productivity issue from a profit or loss perspective. Production bottlenecks that determine process efficiency are often identified at this stage. It is worthwhile to report on the status of production efficiency at this point.

Step 2 — Determine the technical and economic assumptions

The process performance characteristics report serves as the basis for setting the assumptions. It allows you to identify the least and most efficient processes. The identification of assumptions is intended to draw up current objectives for managers of specific processes. In the technical dimension, the assumptions typically relate to the optimisation of production bottlenecks. In the economic dimension, it is worth focusing your attention on cost optimisation, resulting from the cost accounting in management accounting. Technical and economic assumptions serve as the basis for implementing innovative solutions. They make it possible to greenlight the changes that need to happen to make a process viable.

Step 3 — Revenue and capital expenditure forecasts vs. active noise reduction

Afterwards, you must carry out predictive testing. It aims to examine the distribution over time of the revenue and capital expenditure incurred for both the implementation and subsequent operation of the system in an industrial setting.

Forecasted expenditure with ANC
Figure 1 Forecast expenditure in the 2017-2027 period
Forecasted revenue with ANC
Figure 2 Forecast revenue in the 2017-2027 period

From an economic standpoint, the implementation of an active noise reduction system can calm income fluctuations over time. The trend based on the analysis of the previous periods clearly shows cyclicality and a linear trend in terms of both increases and decreases. Stabilisation correlates with the implementation of the system described. This may involve a permanent additional increase in the capacity associated with the system’s implementation into the production process. Hence the conclusion that improvements in productive efficiency result in income stabilisation over time. On the other hand, the implementation of the system requires higher expenditures. The expenditure level is trending downwards year on year, however.

This data allows you to calculate basic measures of investment profitability. At this point, you can also carry out introductory calculations to determine income and expenditure at a single point in time. This allows you to calculate the discount rate and forecast future investment periods [1].

Step 4 — Evaluating investment project effectiveness using static methods

Calculating measures of investment profitability allows you to see if what you wish to put your capital into will give you adequate and satisfactory returns. When facing significant competition, investing in such solutions is a must. Of course, the decisions taken can tip the balance in two ways. Among the many positive aspects of investing are increased profits, reduced costs and a stronger market position. Yet there is also the other side of the coin. Bad decisions, typically based on ill-prepared analyses or made with no analyses at all, often involve lost profits and may force you to incur opportunity costs as well. Even more often, ill-considered investment projects result in a decline in the company’s value. In static terms, we are talking about the following indicators:

  • Annual rate of return,
  • Accounting rate of return,
  • Payback period.

In the present case, i.e. the implementation of an active noise reduction system, we are talking about an annual and accounting rate of return of approximately 200% of the value. The payback period settles at less than a year. This is due to the large disparity between the expenses incurred in implementing the system and the benefits of its implementation. However, to be completely sure of implementation, the Net Present Value (NPV) and Internal Rate of Return (IRR) still need to be calculated in the first place. The NPV and IRR determine the performance of the investment project over the subsequent periods studied.

Step 5 — Evaluating effectiveness using dynamic methods

In this section, you must consider the investment project’s efficiency and the impact that this efficiency has on its future value. Therefore, the following indicators must be calculated:

  • Net Present Value (NPV),
  • Net Present Value Ratio (NPVR),
  • Internal Rate of Return (IRR),

In pursuing a policy of introducing innovation in industrial companies, companies face the challenge of maximising performance indicators. Considering the correlation between the possibilities of applying active noise reduction methods that improve the working conditions, thus influencing employee performance, one may conclude that the improvement in work productivity is reflected in the financial results, which has a direct impact on the assessment of the effectiveness of such a project. Despite the high initial expenditures, this solution offers long-term benefits by improving production stability.

Is it worth carrying out initial calculations of investment returns?

To put it briefly: yes, it is. They prove helpful in decision-making processes. They represent an initial screening for decision-makers — a pre-selection of profitable and unprofitable investment projects. At that point, the management is able to establish the projected profitability even down to the operational level of the business. Reacting to productivity losses allows bosses to identify escaping revenue streams and react earlier to potential technological innovations. A preliminary assessment of cost-effectiveness is a helpful tool for making accurate and objective decisions.

References

[1] D.Begg, G.Vernasca, S.Fischer „Mikroekonomia” PWE Warszawa 2011
[2] mfiles.pl/pl/index.php/Zysk

[3] Felis P., 2005: Metody i procedury oceny efektywności inwestycji rzeczowych przedsiębiorstw. Wydawnictwo Wyższej Szkoły Ekonomiczno-Informatycznej. Warszawa.

Digital image processing

Signal processing accompanies us every day. All stimuli (signals) received from the world around sound, light, or temperature are processed into electrical signals, which are later sent to the brain. In the brain, the analysis and interpretation of the received signal takes place. As a result, we get information from the signal (e.g. we can recognize the shape of an object, we feel the heat, etc.).

Digital signal processing (DSP) works similarly. In this case, the analog signal is converted into a digital signal by an analog-digital converter. Then, using the digital computer, received signals are being processed. The DSP systems also use computer peripheral devices equipped with signal processors which allow processing of signals in real-time. Sometimes, it is necessary to re-convert the signal to an analog form (e.g. to control a device). For this purpose, digital-to-analog converters are used.

Digital signal processing has a wide range of applications. It can be used to process sound, speech recognition, or image processing. The last issue will be the subject of this article. We will deeply discuss the basic operation of convolutional filtration in digital image processing.

What is image processing?

Simply speaking, digital image processing consists in transforming the input image into an output image. The aim of this process is to select information – choosing the most important (e.g. shape) and eliminating unnecessary (e.g. noise). The digital image process features a variety of different image operations such as:

  • filtration,
  • thresholding,
  • segmentation,
  • geometry transformation,
  • coding,
  • compression.

  As we mentioned before, in this article we will focus on image filtration.

Convolutional filtration

Both in the one-dimensional domain (for audio signals) and also for two dimensions, there are specific tools for operating on signals – in this case on images. One of such tools is filtration. It consists of some mathematical operations on pixels which as a result give us a new image. Filtration is commonly used to improve image quality or to extract important features from the image.

The basic operation in the filtration method is the 2D convolutional function. It allows applying of image transformations using appropriate filters in a form of matrix coefficients. The use of filters consists of calculating a point’s new value based on the brightness values of points in the closest neighborhood. Such so-called masks containing pixel weights based on the closest pixels values are used in calculations. The usual sizes of masks are 3×3, 5×5, and 7×7. The process of image and filter convolution has been shown below.

Assuming that the image is represented by a 5×5 matrix which contains color values and the filter is represented by a 3×3 matrix, the image was modified by joining these matrices.

The first thing to do is to transpose coefficients in a filter. We assume that the center of the filtration core h(0,0) is in the middle of the matrix, as shown in the picture below. Therefore (m,n) indexes denoting rows and columns of the filter matrix will be both negative and positive.

Image filtration diagram
Img 1 Filtration diagram

Considering the filter matrix (the blue one) as inverted vertically and horizontally we can perform filtration operations. They start by placing the h(0,0) → h(m,n) element of the blue matrix over the s(-2,-2) → s(i,j) element of the yellow matrix (the image). Then we multiply the overlapping values of both matrices and add them up. In this way, we have obtained the convolution result for the (-2,-2) cell of the output image. It is important to remember the normalization process, which allows us to adjust the brightness of a result by dividing it by the sum of filter coefficients. It prevents the output image brightness from being out of a scale of 0-255 (in the case of 8-bit image representation).

The next stages of this process are very similar. We move the center of the blue matrix over the (-2,-1) cell, then again multiply the overlapping values. Next, add them together and divide the result by the filter coefficients to get the result. We consider cells that go beyond the area of the matrix s (i,j) to be undefined. Therefore, the values do not exist in these places, so we do not multiply them.

The usage of convolutional filtration

Depending on the type of filter, we can distinguish several applications of convolutional filtration. Low-pass filters are used to remove noise from images, while high-pass filters are used to sharpen or emphasize edges. To illustrate the effects of different filters, we will apply them to the real image. The picture below is a “jpg” format and was loaded in Octave software as an MxNx3 pixel matrix.

Original input image
Img 2 Original Input Image

Gaussian blur

To blur the image we need to use a convolutional function as well as the properly prepared filter. One of the most commonly used low-pass filters is the gaussian filter. It allows you to lower the sharpness of the image but also it is used to reduce the noise from it.

For this article, a 29×29 matrix based on Gaussian function with a standard deviation of 5 was generated. The normal distribution gives weights to the surrounding pixels during the process of convolution. A low-pass filter suppresses high-frequency image elements while passing low-frequency elements. The output image compared to the original one is blurry, and the noises are significantly reduced.

Blurred input image
Img 3 Blurred input image

Sharpen

We can make the image blurry but there is also a way to make it sharpen. To make it happen a suitable high-pass filter should be used. The filter passes through and amplifies image elements that are characterized by high frequency e.g. noise or edges. However, low-frequency elements are suppressed. By using this filter, the original image is sharpened – it can be easily noticed especially in the arm area.

Sharpened input image
Img 4 Sharpened input image

Edges detection

Another possible image process is called edge detection. Shifting and subtracting filters are used to detect edges on the image. They work by shifting the image and subtracting the original image from its copy. As a result of this procedure, edges are being detected, as shown in the picture below.

Edge detection
Img 5 Edge detection

BFirst.Tech experience with image processing

Our company hires well-qualified staff with experience in the field of image processing. One of our original projects was called TIRS, i.e. a platform which diagnoses areas in the human body that might be affected by cancerous cells. It works based on the use of advanced image processing algorithms and artificial intelligence. It automatically detect cancerous areas with the use of medical imaging data obtained from tomography and magnetic resonance imaging. This platform finds its use in clinics and hospitals.

Our other project, which also requires the usage of image processing, is called the Virdiamed platform. It was created in cooperation with Rehasport Clinic. This platform allows a 3D reconstruction of CT and MRI data and also allows the viewing of 3D data in a web browser. If you want to read more about our projects, click here.

Digital signal processing, including image processing, is a field of technology with a wide range of application possibilities, and its popularity is constantly growing.  Non-stopping technological progress means that this field of technology is also constantly developing. Moreover, any technologies used every day are based on signal processing, which is why it is certain that in the future the importance of DSP will continue to grow.

References

[1] Leonowicz Z.: „Praktyczna realizacja systemów DSP”

[2] http://www.algorytm.org/przetwarzanie-obrazow/filtrowanie-obrazow.html